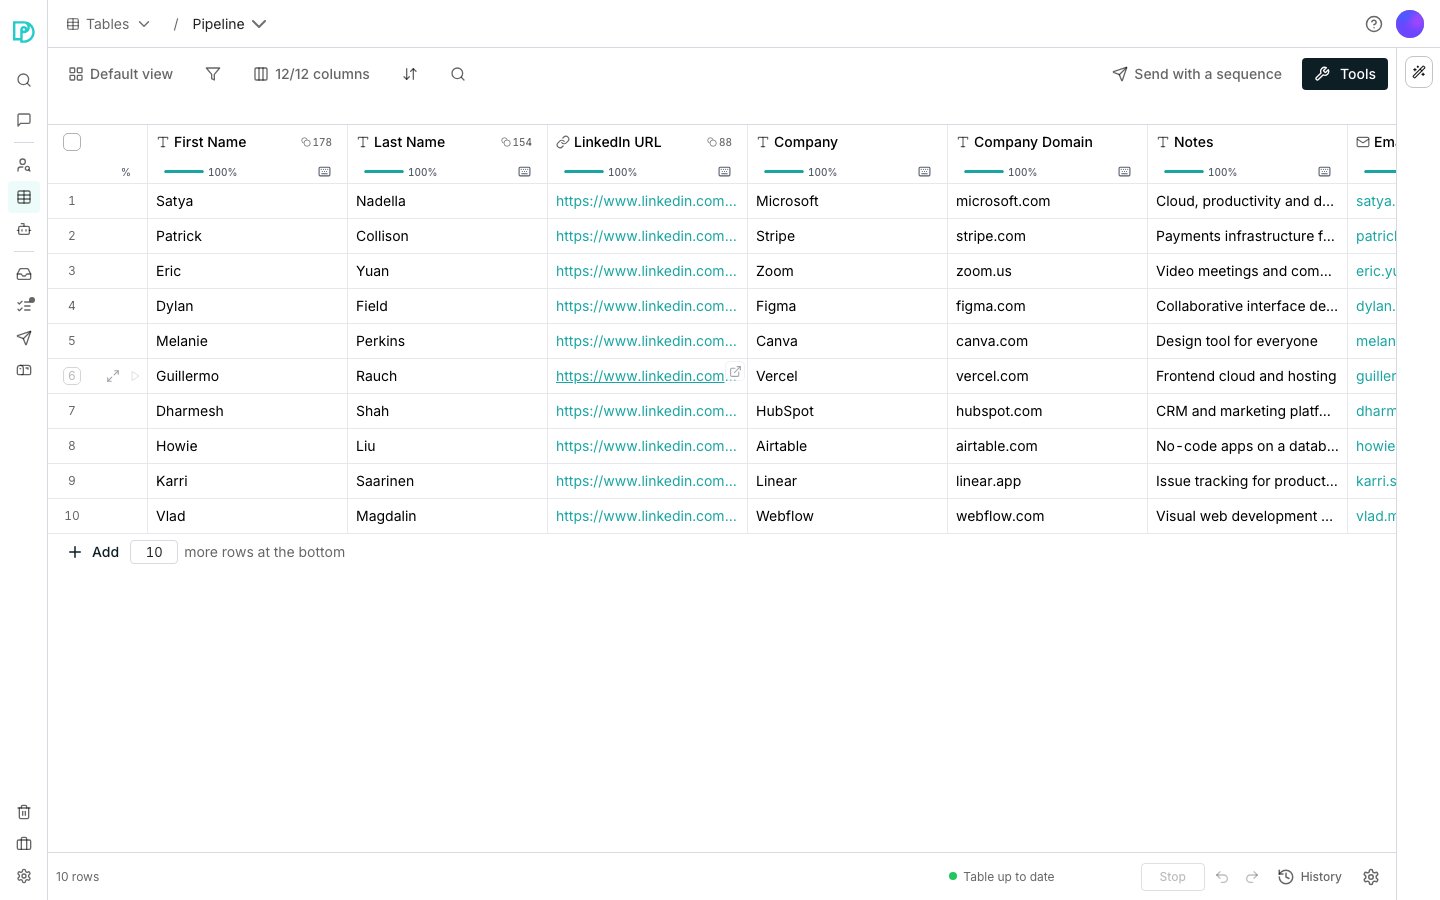
A table's rows and cells.
See a column’s value distribution
Open a column’s header menu, open More and choose Show value distribution. It shows the top 20 values with counts and percentages, distinct values, empty cells and Other values for the remaining values. Counts cover every row in the table, including rows outside the current view’s filters. Empty cells count toward the percentage total; zero and false count as values. Objects and lists are counted as whole values. The AI Assistant can read the same distribution. Ask which values are most common or how many cells are empty in a named column.Work with rows and cells
Open a table from Tables and it works like a spreadsheet.- Edit a cell: click it and type to replace what is there, or double-click to edit the existing value.
- Add rows: set a count at the bottom of the table and click Add. The rows are added empty at the end.
- Insert a row: right-click a cell and choose Insert 1 row above or Insert 1 row below. The AI Assistant can add rows there too.
- Open a row in full: hover its gutter and click the expand icon. The panel lists every visible column as a labelled field, which beats scrolling sideways.
Act on several rows at once
Tick a row’s checkbox in the gutter, or the header checkbox for the whole page. A bar appears with Send with a sequence, Export and Delete, plus Run when the table has a column that runs. In a narrow window the first button reads Send.Good to know
Can I undo deleting rows?
Can I undo deleting rows?
A delete shows an undo for a few seconds. After that the rows are gone for good.
How is clearing a cell different from deleting a row?
How is clearing a cell different from deleting a row?
Clearing empties the value and leaves the row in place. The value comes back after that column’s next run.
Can changing a column's type blank cells?
Can changing a column's type blank cells?
Values that cannot be read as the new type are cleared, so switching a text column to Number loses anything that was not a number.
Why can't I hide the last column?
Why can't I hide the last column?
A table always shows at least one column, so the last one cannot be hidden or deleted.
How do I rename, reorder or hide columns?
How do I rename, reorder or hide columns?
Double-click a header to rename it in place, or open its menu and choose Rename. Drag a header to reorder it.The columns control in the toolbar shows a count, like “10/10 columns”, and only its icon when the toolbar is narrow. Open it to hide a column or drag it to a new position.A column folded into a group is marked with that group after its name, such as “in Name”. The count takes a folded group as one column.
What does Low confidence on a cell mean?
What does Low confidence on a cell mean?
The run that filled the cell was not sure of its answer. The value comes first and the tag sits at the cell’s right edge, so check that answer before you rely on it. A fairly sure answer carries a small mark instead, and a confident one carries nothing.In a narrow column the tag reads Low, and hovering it shows the full words.
Can I fill and paste like a spreadsheet?
Can I fill and paste like a spreadsheet?
A selected cell has a drag handle at its corner that fills its value down the column. Pasting more rows than the table holds adds the extra rows.
Where do structured values unpack?
Where do structured values unpack?
A cell holding a whole record shows as a single value in the table. Open the row panel and it unpacks into its fields, each of which you can give its own column.
Next steps
Enrichment columns
Add work emails, phone numbers and company facts from outside sources.
Function columns
Turn the data you already have into new values, for free.
Views
Change what you are looking at without touching the data.
Run columns
Decide when your data updates: automatically, or only when you say so.
Create a table
Start a new table from a search, a file or a tool.