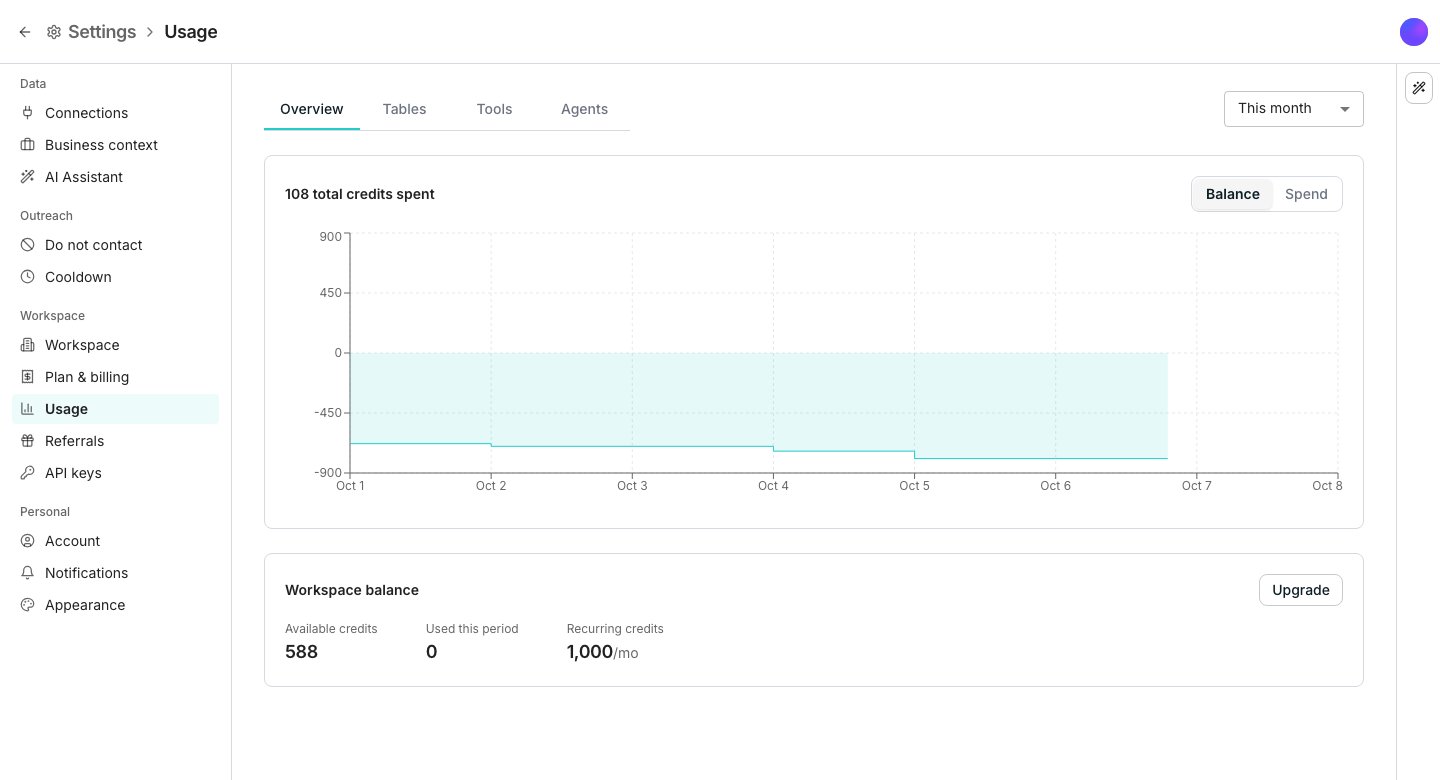
The Usage page, Overview tab.
Read the overview
The Overview tab toggles between a Balance chart and a Spend chart, over a time range you choose. A Workspace balance card sits below it, with one button: Buy credits, or Upgrade when your workspace cannot buy credits.Break spend down
On Usage, three tabs group the same spend by a different entity.- Tables, Tools and Agents each break the spend down their own way.
- The date range above the tabs applies to every tab as soon as you change it.
- Expanding a row shows the detail. A table expands into its columns, and a tool expands into the account behind it.
- Export downloads the full report for the chosen date range, not just the rows on screen.
Good to know
Does the filter box on a tab narrow what I export?
Does the filter box on a tab narrow what I export?
No. The filter box only narrows what you see on screen. Export always covers the full report for the date range you chose.
How far back does usage history go?
How far back does usage history go?
An info icon on each breakdown tab states how far back Oneprofile has data, so you know when a widened range stops adding anything.
What is the difference between the Tools tab and an agent's cost?
What is the difference between the Tools tab and an agent's cost?
Tools groups spend by the connected tool or data source a run used. Agents groups the same spend by which agent triggered it.
Next steps
Credits and billing
Buy credits and manage your plan.
What agents cost
Understand what drives an agent’s spend before you run one.