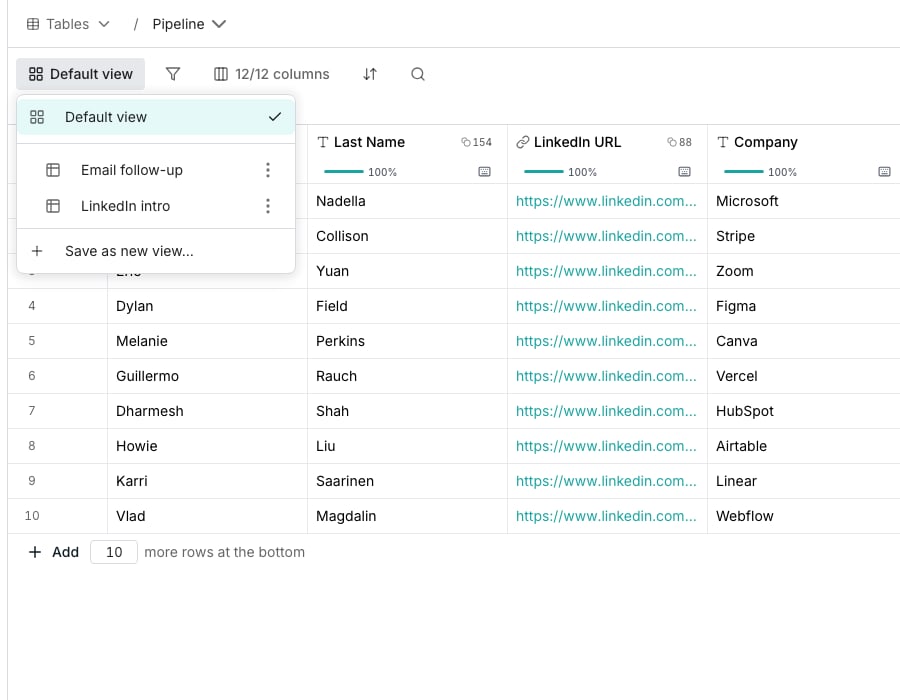
The view switcher, open on a table.
Switch view
Open a table from Tables, then click the view switcher at the left of the toolbar. It always shows the name of the view you are in. Default view has no sort and no filters, and its columns are laid out your way.Pick up where you left off
A table opens the way you last left it, with any filter or sort you had not saved. This is yours alone.Save your own view
Set the filters, sort and visible columns you want, then open the view switcher and choose Save as new view…. The dialog lists the rows, order and columns the view will keep. Name it, and it appears in the list for everyone with access to the table. On Default view, a filter or a sort also brings Discard and Save as new view… to the toolbar.Change a saved view
Change a filter, the sort or a column in a saved view, and Discard and Update view appear in the toolbar. Update view saves it for everyone, and Discard goes back to it as saved.Views and run conditions
Creating a column inside a saved view automatically sets the column to follow that view’s filter as its run condition. The column only runs on rows the view includes, and editing the view’s filter updates which rows the column runs on. See Set a run condition for how following, detaching and deleting a view work with run conditions.Good to know
Where did Errored rows and Fully computed rows go?
Where did Errored rows and Fully computed rows go?
They are filters now. Open Filter and choose Has an error or Has no errors. Unlike the old views, they save into a view and combine with your other filters.A link to one of the old views still opens on the same rows, with the filter in place.
Where did Non-formula columns go?
Where did Non-formula columns go?
Open the columns control, choose Show or hide, and hide the formula columns in one click. Show all columns brings back every hidden column.
What does a table open on?
What does a table open on?
A link opens exactly what it shows. Otherwise a table opens the way you last left it. A table you have not opened before opens on the view the team set to open by default, or on Default view.
How do I keep my changes without changing the view?
How do I keep my changes without changing the view?
Click the arrow beside Update view and choose Save as new view…. The arrow also holds Update view for everyone.
Who sees the columns I hide?
Who sees the columns I hide?
Inside a saved view, showing or hiding a column changes that view, for everyone once you choose Update view. On Default view, hiding, pinning or resizing a column changes it for you alone. Column colors are shared with everyone on the table.
What happens to my changes if I switch view?
What happens to my changes if I switch view?
Oneprofile asks first. Choose Update view to save them, or Save as new view… on Default view, and you land on the view you picked. Keep editing stays where you are, and Discard changes switches without them.Leaving the table never asks. Your changes are still there when you come back.
What happens to a sequence that uses this view?
What happens to a sequence that uses this view?
A sequence can read its contacts through a saved view. When you change that view’s filter, Update view first counts what it does to each such sequence: Added, Removed and Not changed.Saving applies the filter to those sequences at once, and contacts it no longer selects stop. A filter that adds and stops nobody saves without asking. See Choose the audience.
Why can't I delete a view?
Why can't I delete a view?
A sequence reads its contacts through it. Deleting it would point the sequence at the whole table, so the delete is refused and names the sequence. Change that sequence’s audience first.
What does the columns control count?
What does the columns control count?
The toolbar control reading something like 6/9 columns is where you show, hide and reorder columns. It shows the count at all times, so a hidden column is never a mystery.
Where did the view switcher go?
Where did the view switcher go?
Into More, at the left of the toolbar, with Filter, the columns control and Sort. That happens when the toolbar is very narrow, such as on a small window beside the AI Assistant. Widen the window and it comes back.
Next steps
Filter, sort and search
Set up what a view saves.
Run columns
Decide when a column fills its cells, and over which rows.