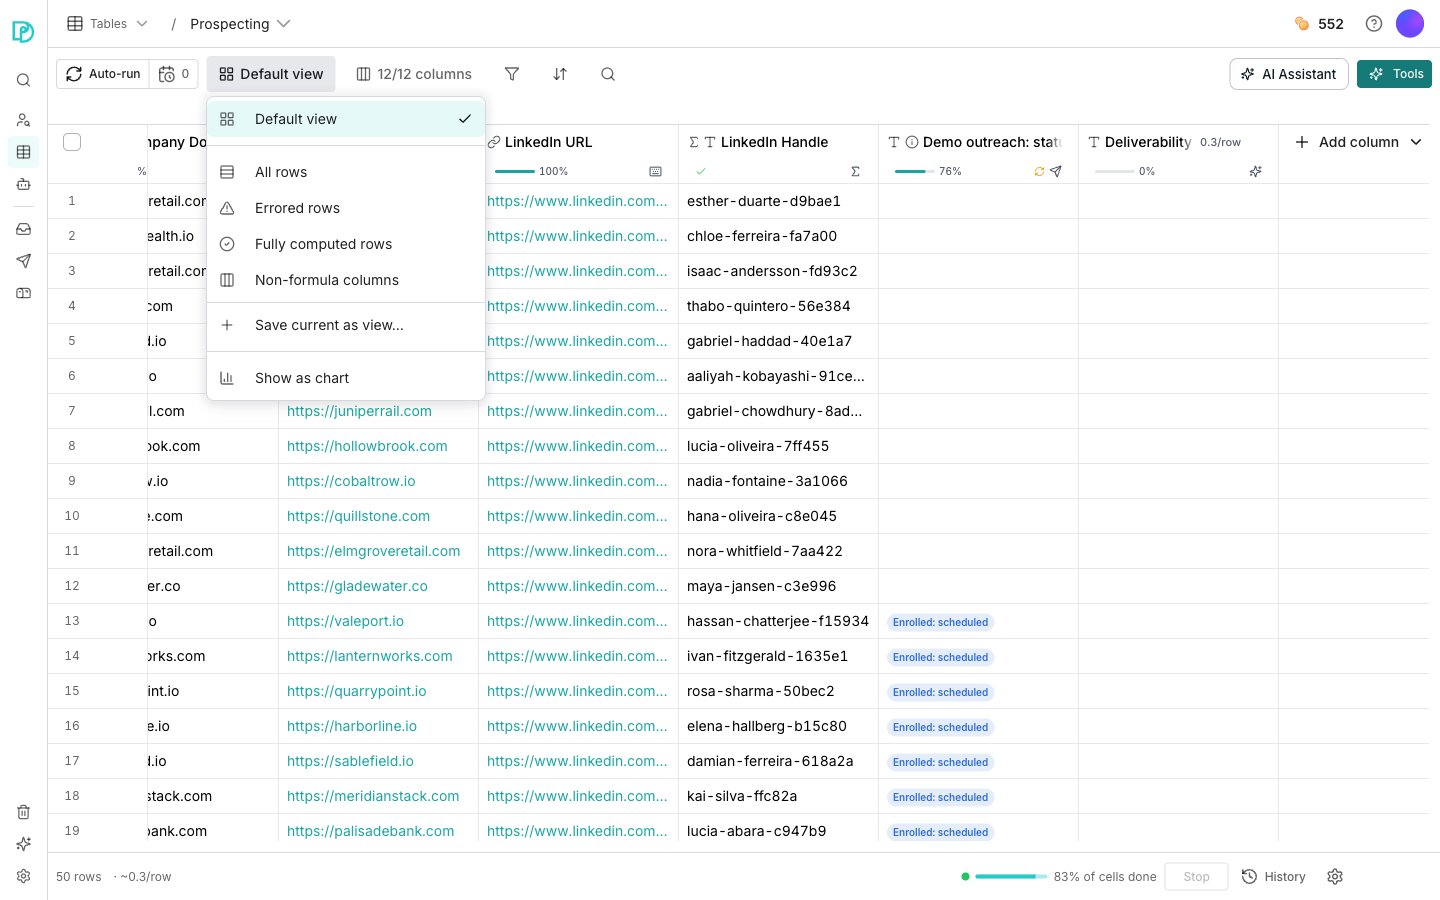
The view switcher.
Switch view
The view switcher sits in the toolbar, beside the run controls. Default view is the table as everyone shares it, with no sort and no filters. Every table also ships with four built-in views:- All rows: every row and column, with no filters applied
- Errored rows: rows where a cell failed to compute
- Fully computed rows: rows where nothing failed
- Non-formula columns: hide every computed column
Save your own view
1
Set the table up the way you want it
Adjust the sort, add filters, or hide the columns you do not need.
2
Save it
Open the view switcher and choose Save current as view…. Name it, and it appears in the list for everyone with access to the table.
Narrow what you are looking at
Filter, Sort and Search sit beside the view switcher, along with a count of the columns on screen. Filter narrows rows to those matching a condition. Sort orders them by one or more columns. Search steps through matching cells. None of the three changes your data, so it is safe to experiment.Good to know
Updating a view after you change it
Updating a view after you change it
While one of your saved views is active, the switcher offers to update it with your current setup. Choosing that writes the sort, filters and visible columns back onto the view for everyone.
Showing a view as a chart
Showing a view as a chart
Show as chart, at the foot of the switcher, plots the rows you are looking at instead of listing them. Show as grid puts them back. It is a way of presenting the current view, not a view you save.
The columns control is a count
The columns control is a count
The toolbar control reading something like 6/9 columns is where you show, hide and reorder columns. It shows the count at all times, so a hidden column is never a mystery.
Search tells you how far it counted
Search tells you how far it counted
Search reports where you are, for example 3 of 40. When more rows match than have loaded into the grid, it says how many it is stepping through.
Next steps
Run columns
Decide when a column fills its cells, and over which rows.
Export to a tool
Push rows from this table into a connected system.