> ## Documentation Index
> Fetch the complete documentation index at: https://docs.getoneprofile.ai/llms.txt
> Use this file to discover all available pages before exploring further.
# Chart a view
> Turn the rows in a view into a chart, and read it without leaving the table.
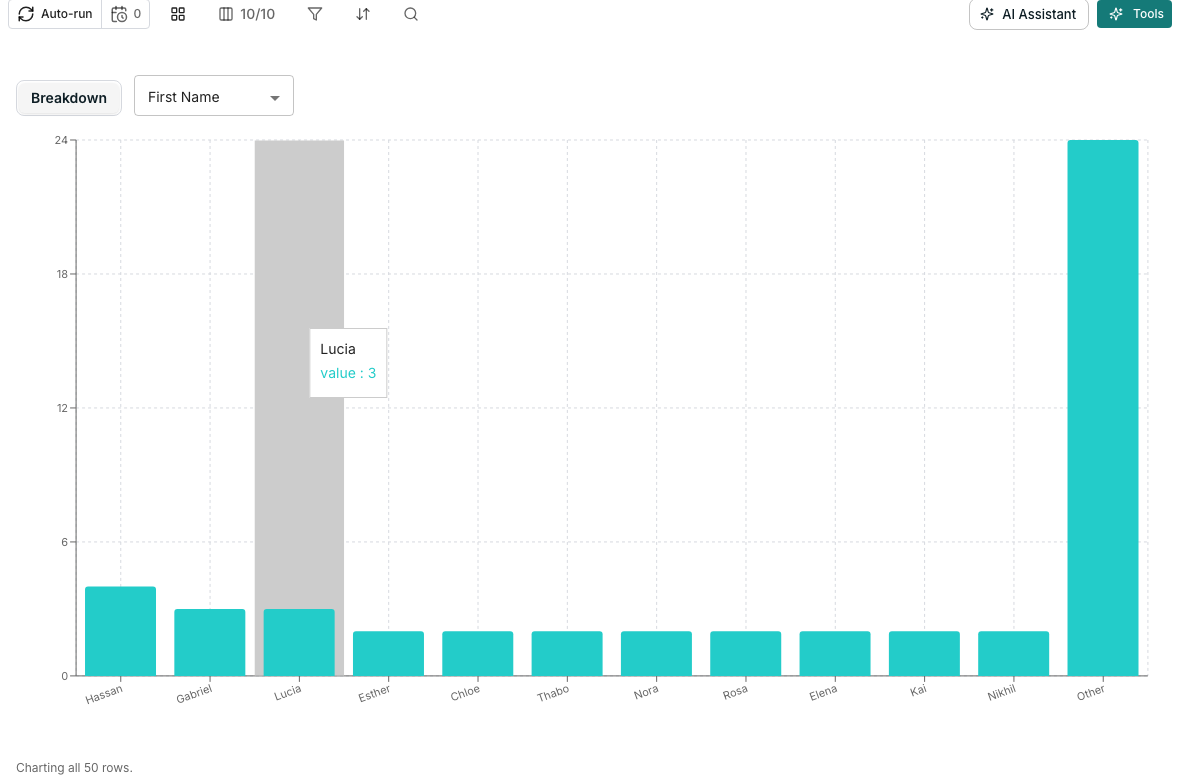
A chart turns the rows in front of you into a picture, right where you are. It draws over whatever the grid has loaded, so it always matches your filter and view.
 ## Open the chart
Open the view control in the toolbar.
Choose **Show as chart**. The same menu offers **Show as grid** to switch back.
## Pick a shape
Choose one shape at a time from the toolbar above the chart:
* **Breakdown**, counting rows by a **Column**
* **Numeric by category**, comparing a **Value** across a **Group by** column, as a **Sum** or an **Average**
* **Count over time**, plotting rows by a **Date column**
## What it draws
A chart always matches your filter and active view, since it draws the same rows the grid has loaded. A caption under it says how many rows are covered, and asks you to scroll for the rest if more are still loading.
## Good to know
A blank cell groups under **(blank)** for **Breakdown** and **Numeric by category**. **Count over time** drops a row with no date instead, since there is nowhere to place it on the timeline.
No. Average is computed only over rows that have a value in the value column, so blank cells never pull it down.
The smallest categories fold into a single **Other** bucket, so a chart never draws one bar per unique value.
No. Chart mode is a way of looking at your rows, not a saved property of a view. It is not part of what a saved view remembers.
## Next steps
Save the filter and sort a chart is drawing from.
Change what a chart covers by narrowing the rows first.
## Open the chart
Open the view control in the toolbar.
Choose **Show as chart**. The same menu offers **Show as grid** to switch back.
## Pick a shape
Choose one shape at a time from the toolbar above the chart:
* **Breakdown**, counting rows by a **Column**
* **Numeric by category**, comparing a **Value** across a **Group by** column, as a **Sum** or an **Average**
* **Count over time**, plotting rows by a **Date column**
## What it draws
A chart always matches your filter and active view, since it draws the same rows the grid has loaded. A caption under it says how many rows are covered, and asks you to scroll for the rest if more are still loading.
## Good to know
A blank cell groups under **(blank)** for **Breakdown** and **Numeric by category**. **Count over time** drops a row with no date instead, since there is nowhere to place it on the timeline.
No. Average is computed only over rows that have a value in the value column, so blank cells never pull it down.
The smallest categories fold into a single **Other** bucket, so a chart never draws one bar per unique value.
No. Chart mode is a way of looking at your rows, not a saved property of a view. It is not part of what a saved view remembers.
## Next steps
Save the filter and sort a chart is drawing from.
Change what a chart covers by narrowing the rows first.